Case study at
Customer segment report using RFM model
How I developed data visualization using the RFM model to support merchants to get the new concept and their customer management
👩🏻💻
My role
Product Design
💻
Platform
Web-app
⏱️
Timeline
August-September 2024
💬
Context
Haravan is a company operating in the e-commerce sector in Vietnam, providing merchants with omni-channel sales solutions as well as business operation systems.
Recently, our merchants who are business having focused on improving customer management. They’ve expressed a need to understand customer behavior and enhance relationships with their key customers.
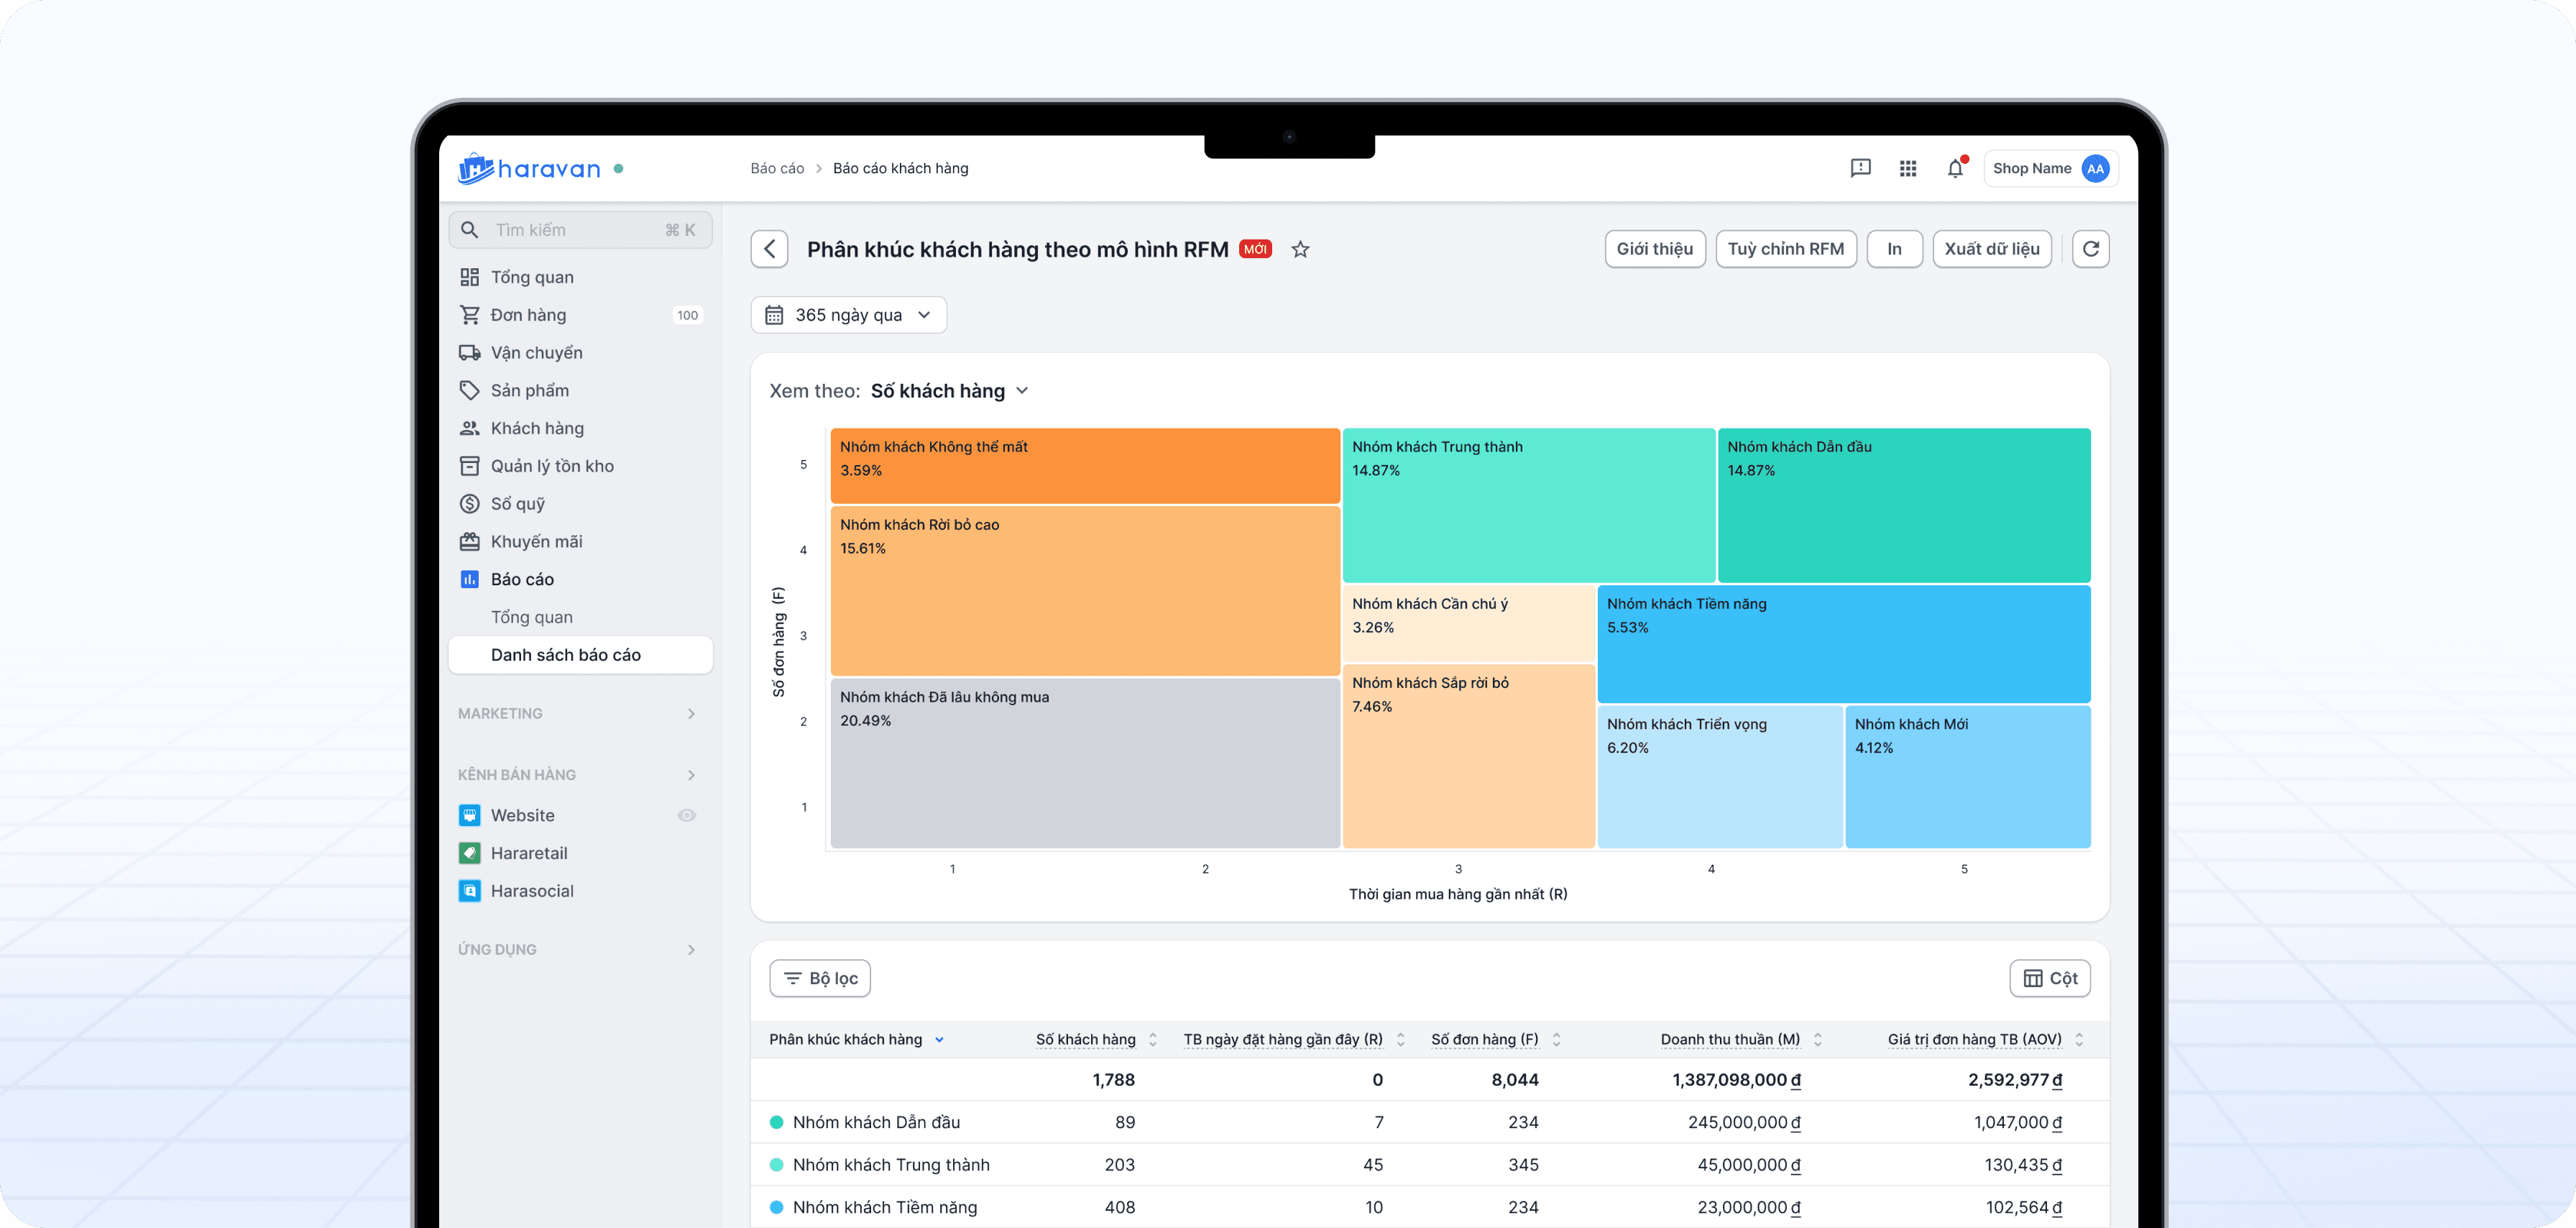
In response, our team started to develop a customer segmentation report using the RFM model. This new report helps classify and identify segments within merchants' business

At the beginning, I had no idea what RFM was
So I started by learning about this term
Quick overview of RFM
RFM
What is RFM?
It’s a customer analysis model standing for 3 main elements in customer buying behavior:
(R) Recency - How recently did the customer make a purchase?
(F) Frequency - How often does the customer place an order?
(M) Monetary Value - How much does the customers spend?
These three reveal the value each customer brings to the business.
How does RFM work?
It operates on a scoring mechanism, with each element (R, F, M) assigned values on a scale from 1 (min) to 5 (max).
Relying on the business model, businesses can decide on their own appropriate scoring scale.
From there, each customer will have a corresponding RFM score.
How can business can see those metrics?
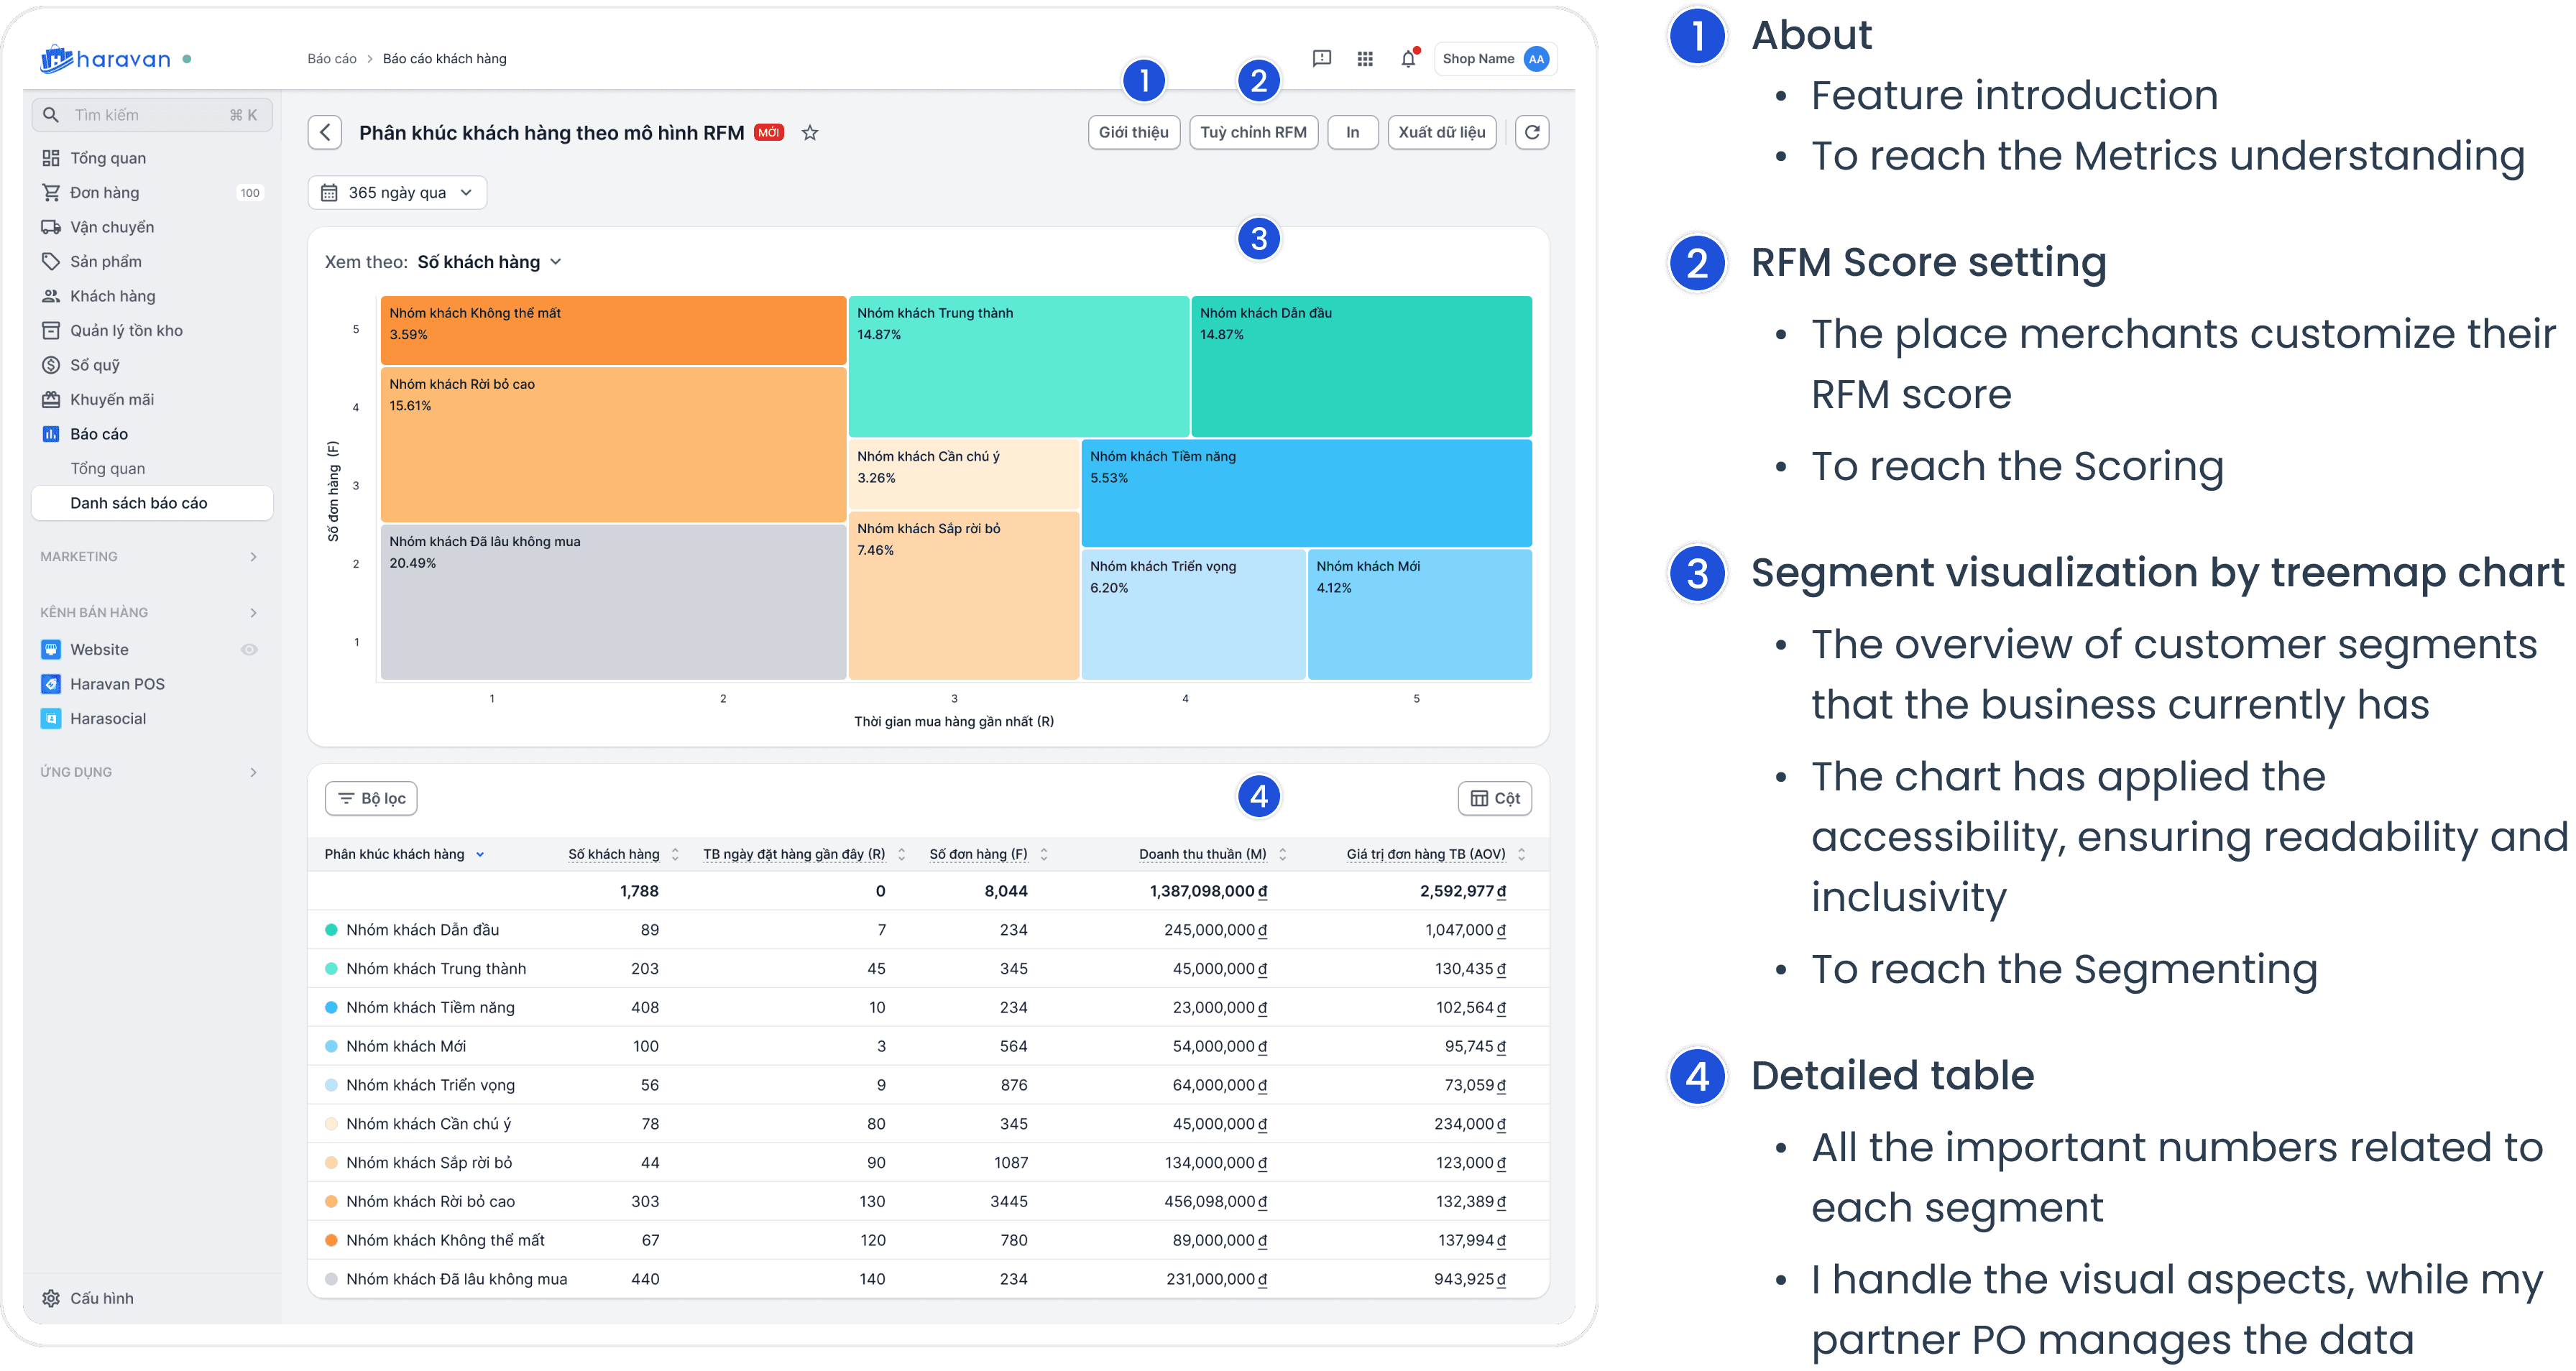
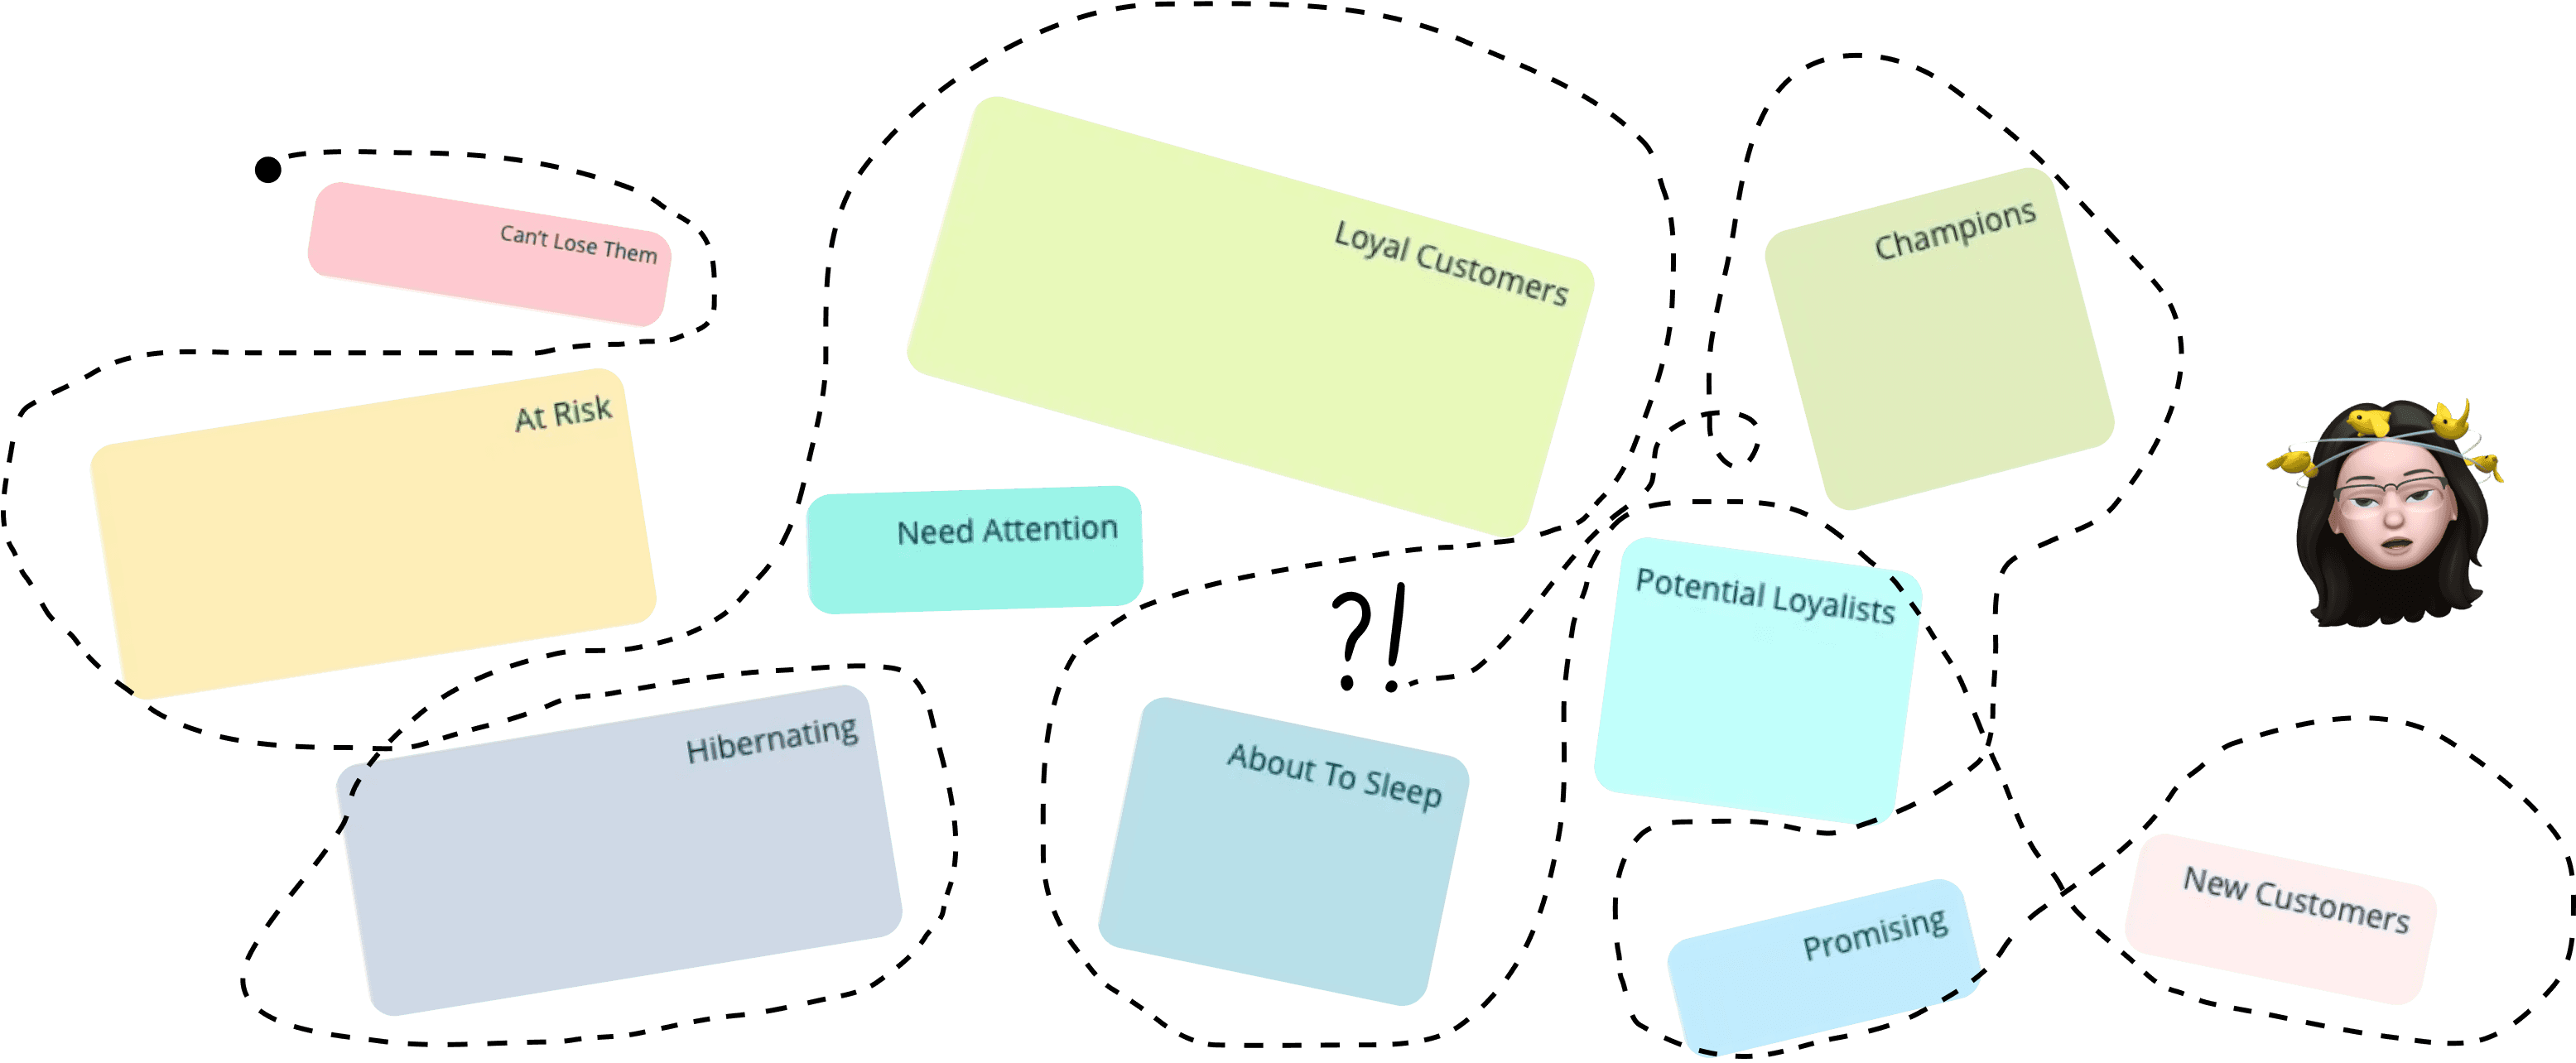
These RFM scores correspond to 10 customer segments already defined by the model. Each customer has been identified as belonging to a specific segment.
Finally, the customer segments are displayed in treemap chart.

This can deliver value to merchants through customer data, but...
Problem
Its specialized and technical nature presents certain challenges
Problem 1:
Not yet familiar with the RFM model and scoring
Several merchants find RFM and its terms unfamiliar because they have not encountered this model before.
Problem 2:
In RFM model, there are sum of 10 segments. This make merchants don’t know how to view the chart and identify the segments.

So our objective is to help merchants access this model in a simpler manner
Objective
RFM
Metrics understanding
Merchants can get the new term “RFM model” and its three metrics R, F, M
Scoring
After understanding, merchants have ability to set their own RFM score
Segmenting
Merchants view and identify customer segments on the chart
Solution
Its specialized and technical nature presents certain challenges
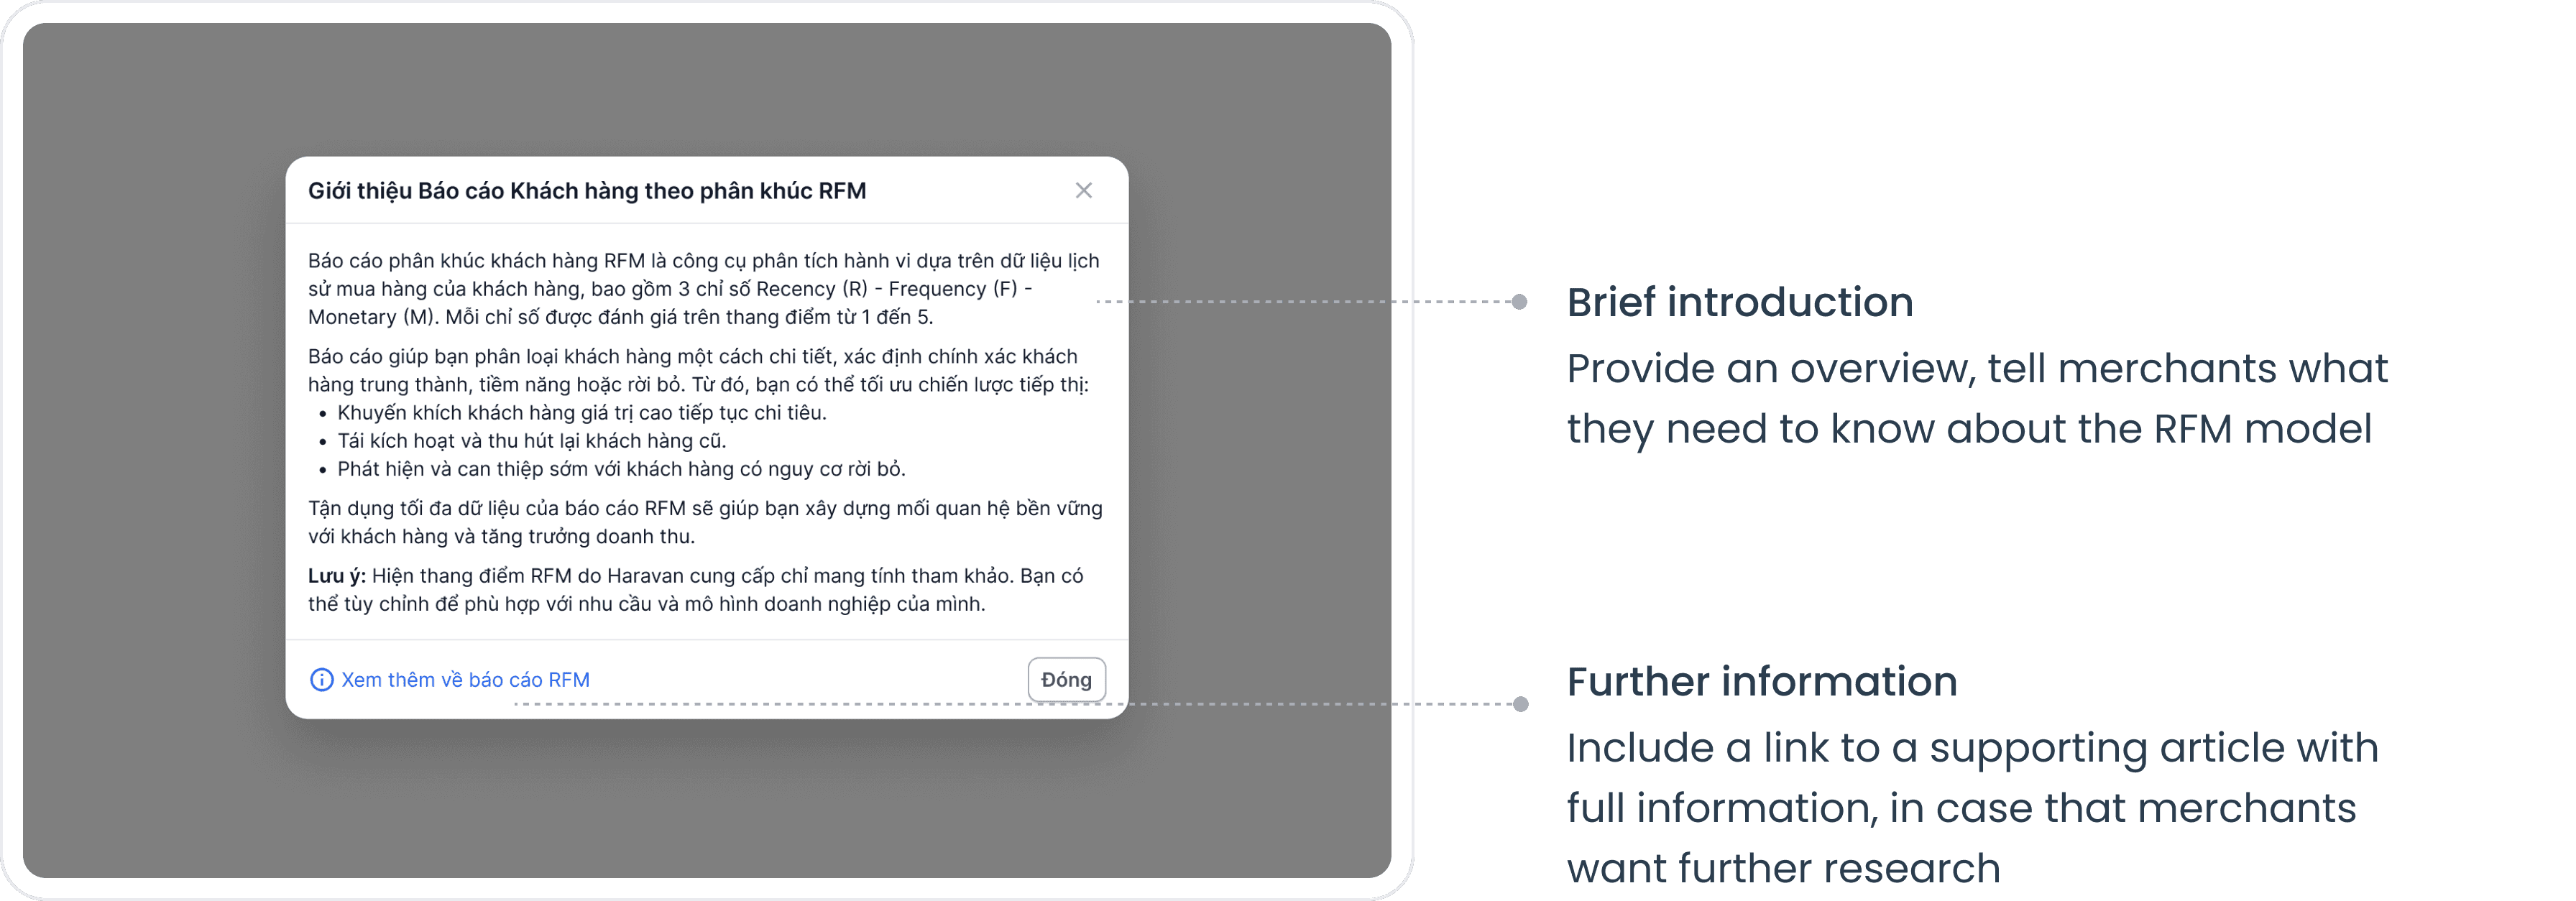
1. About
We’ve decided to build the comprehensive contents to give merchants precisely new knowledge
2. RFM Score setting
🚧
Challenge
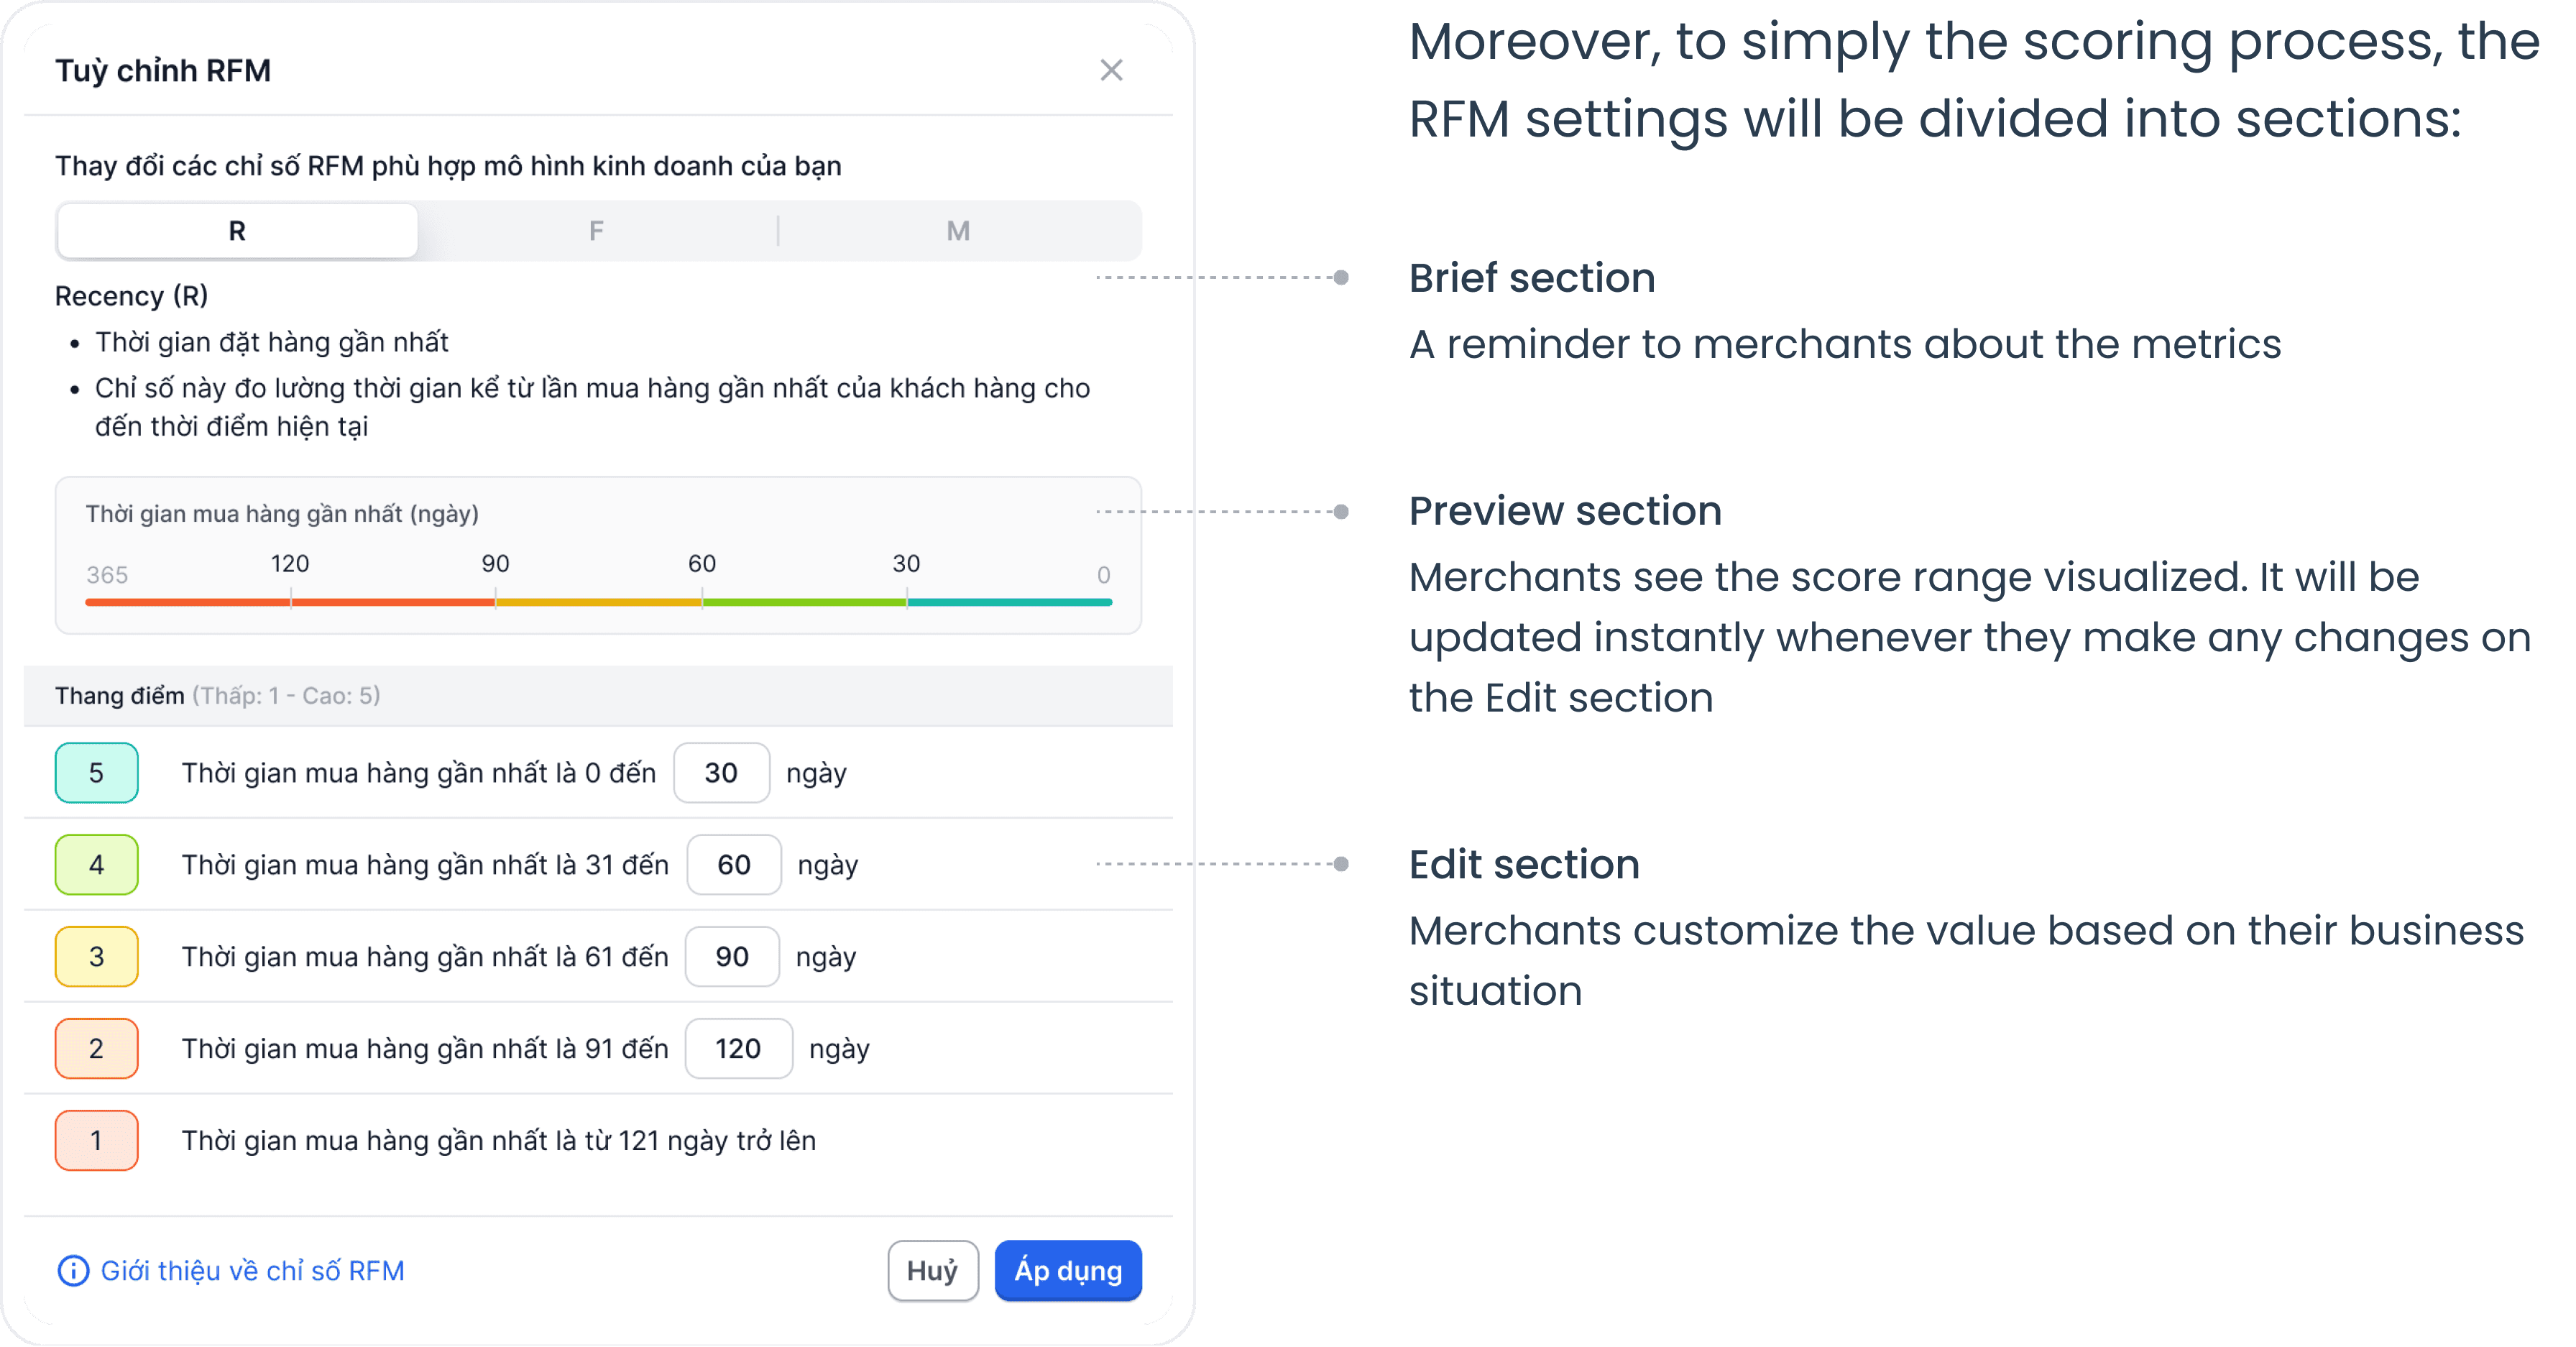
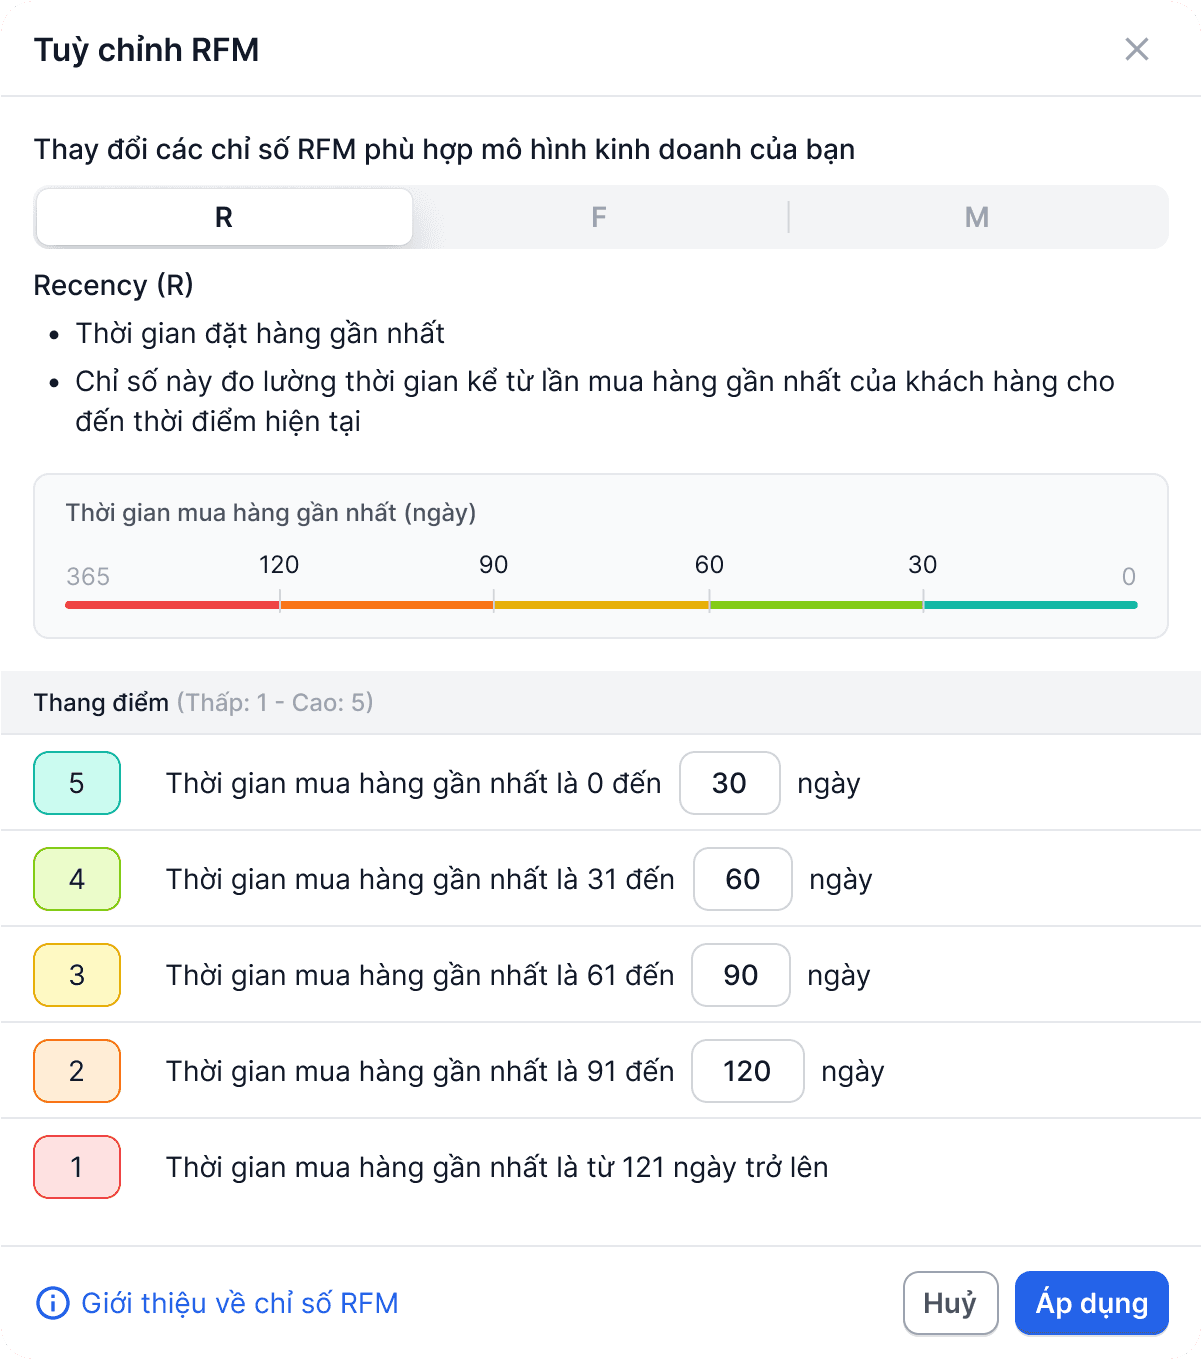
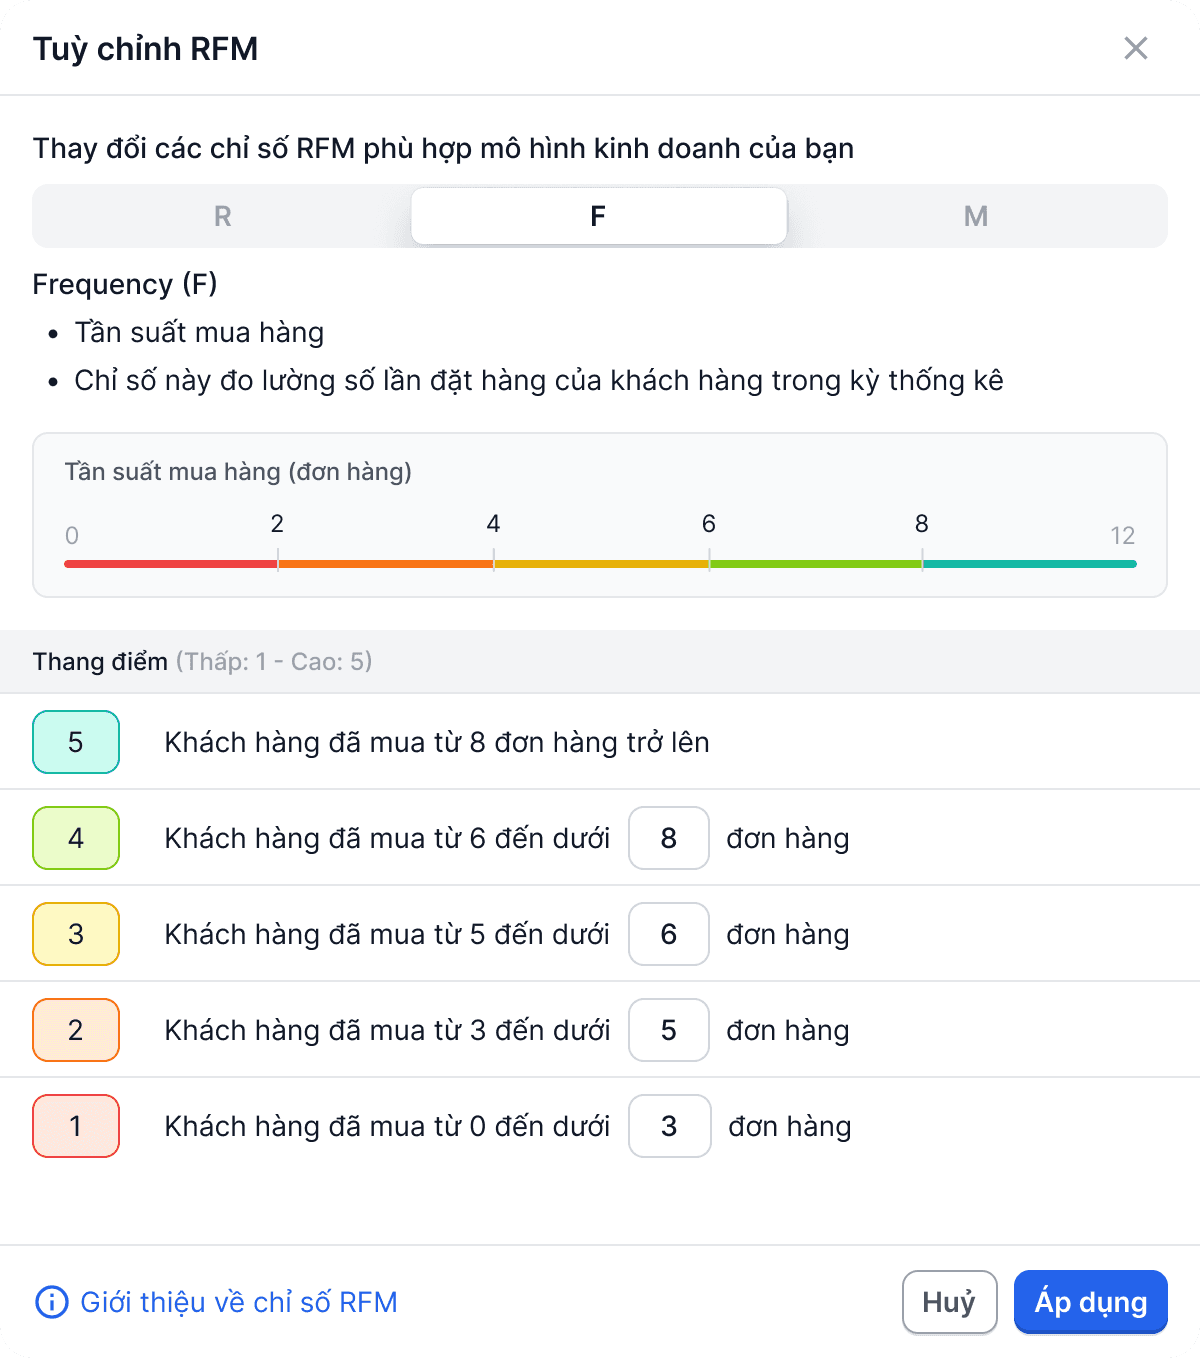
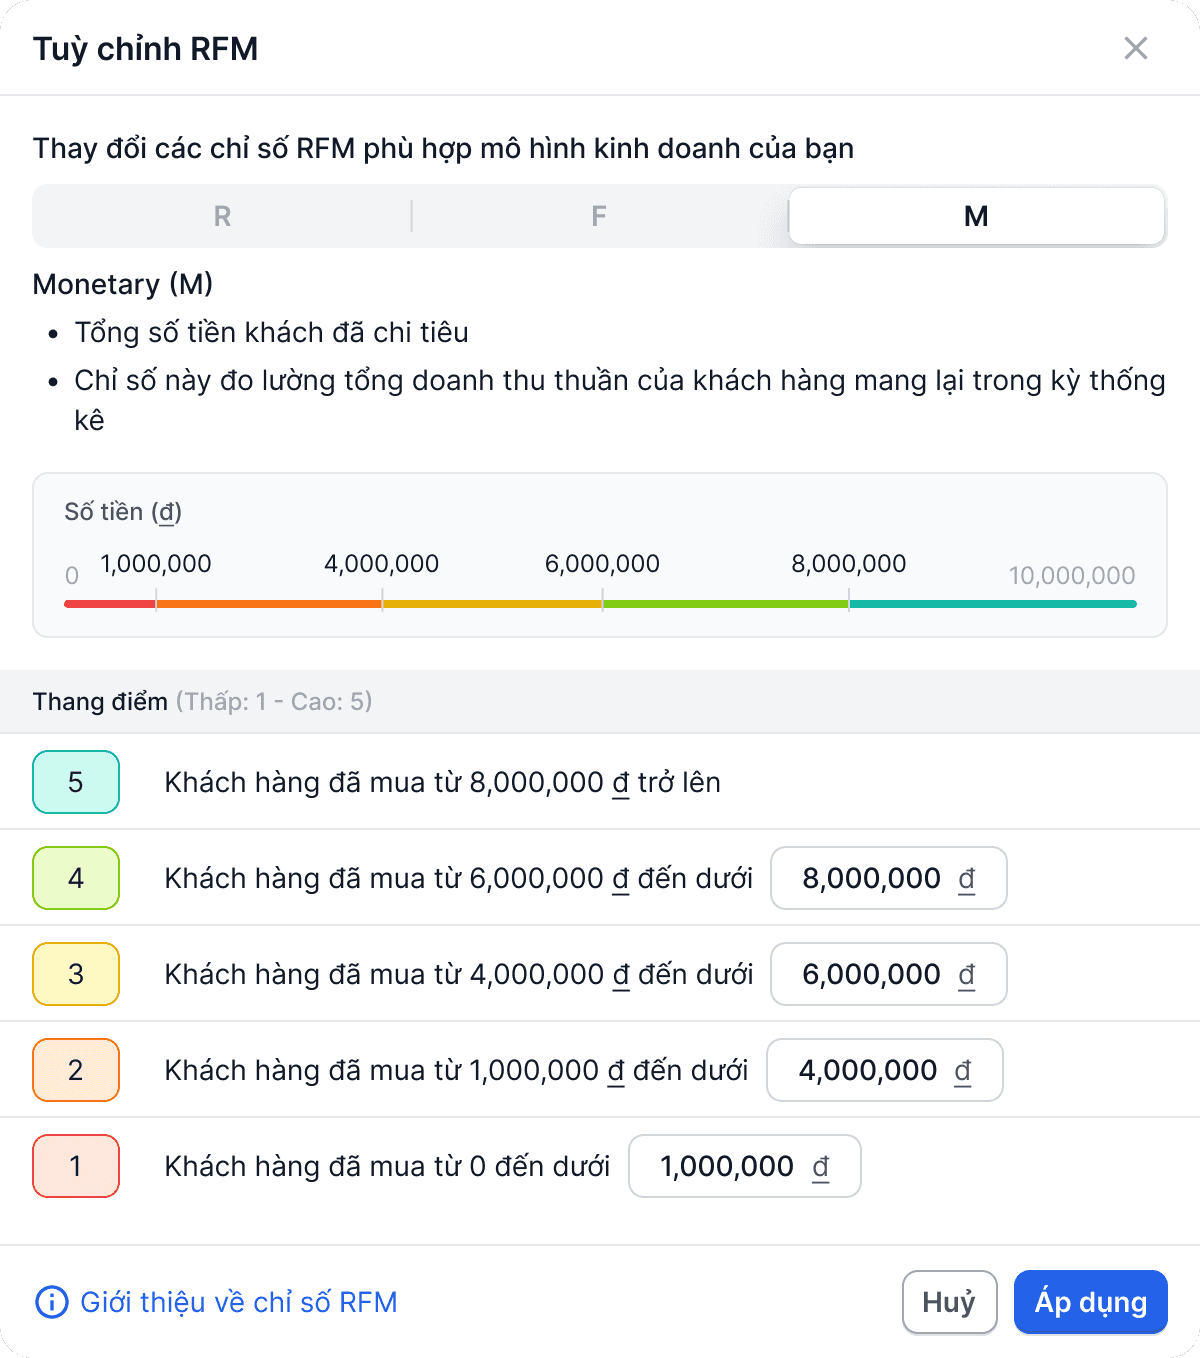
In this section, my challenge is to simplify the scoring, so that merchants can customize their RFM rules to better suit their businesses
🧠
Ideate
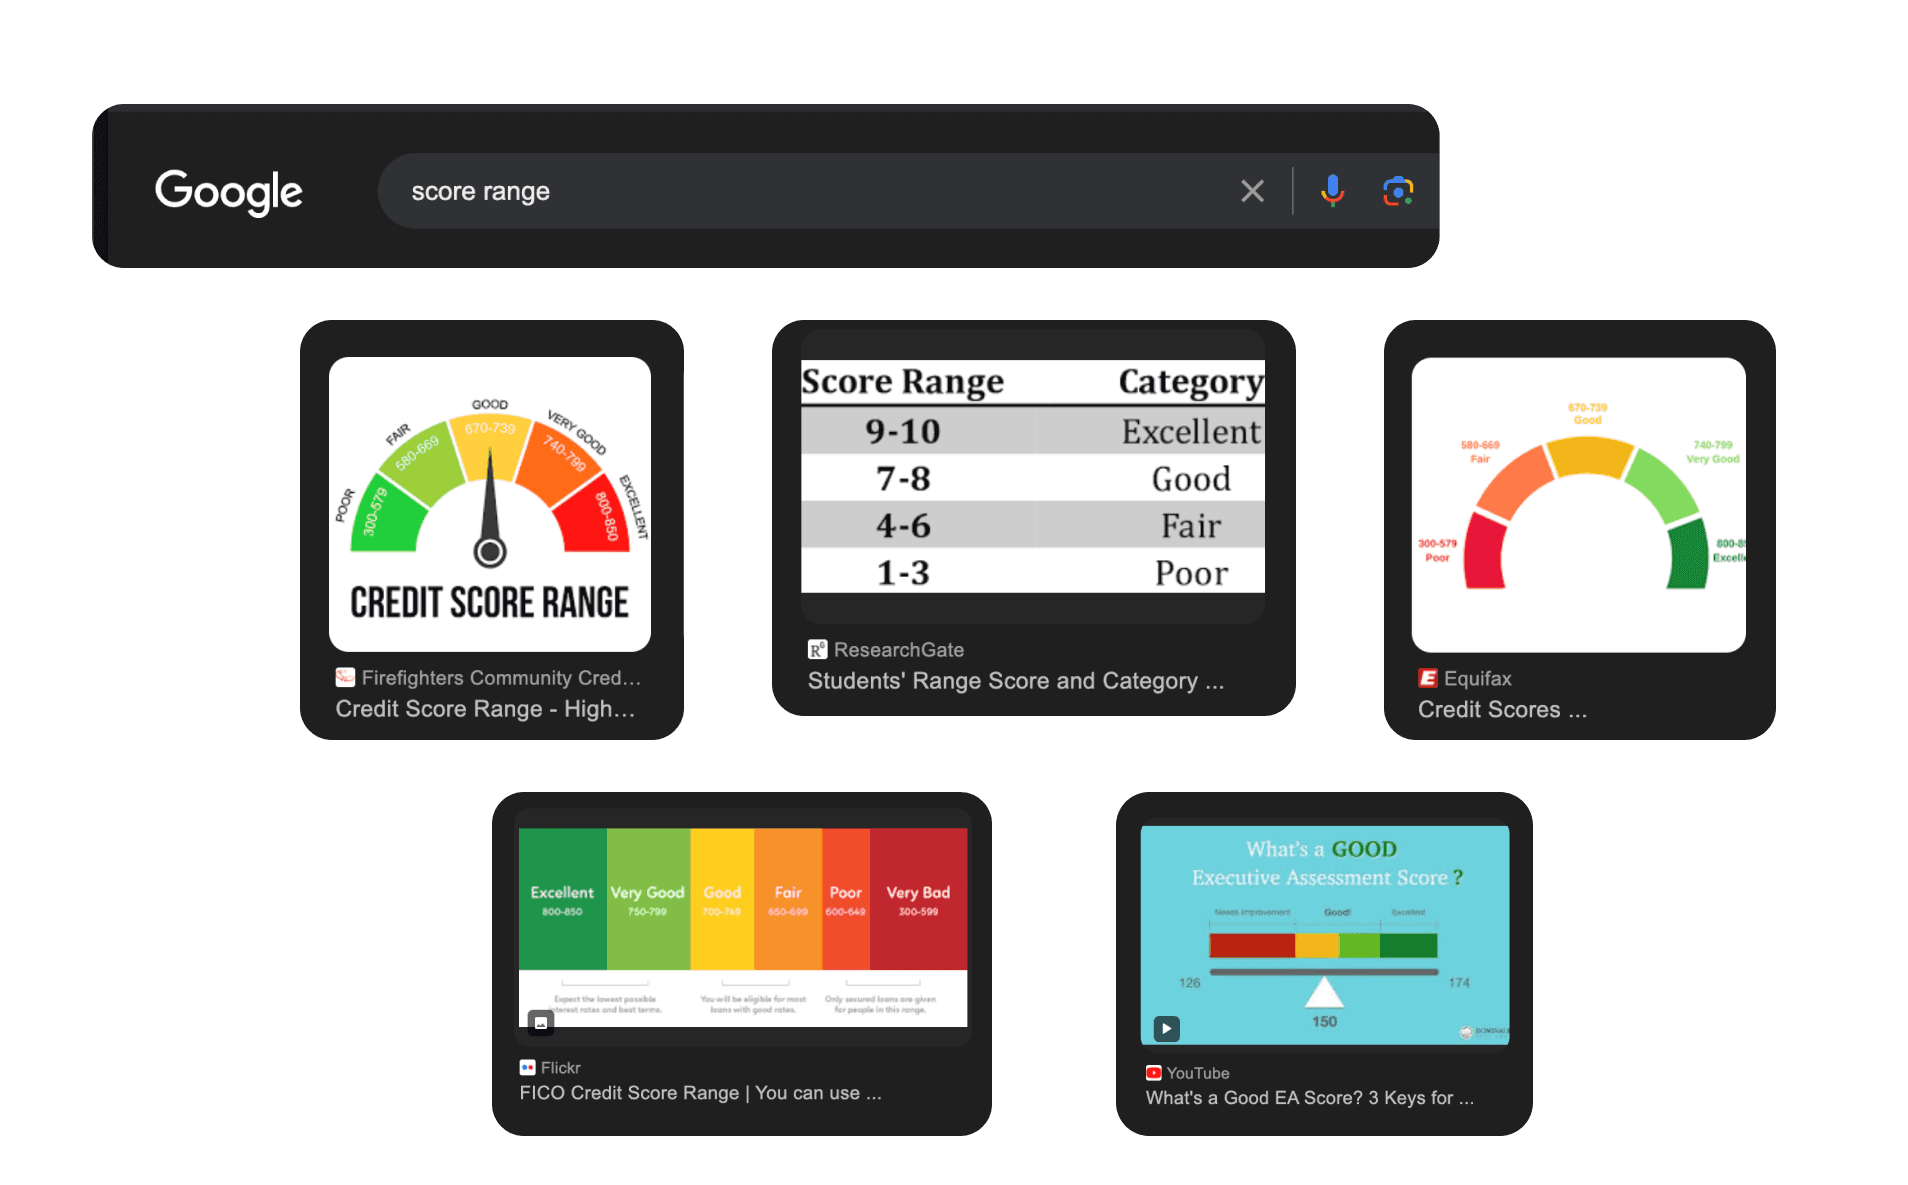
When I brainstormed ideas, I explored and got the inspiration that I would keep the nature of the score range displaying 5 ranges

And the setting will have predefined values for each metric
R - Recency metric
F - Frequency metric
M - Monetary metric
3. Segment visualization by treemap chart
🚧
Challenge
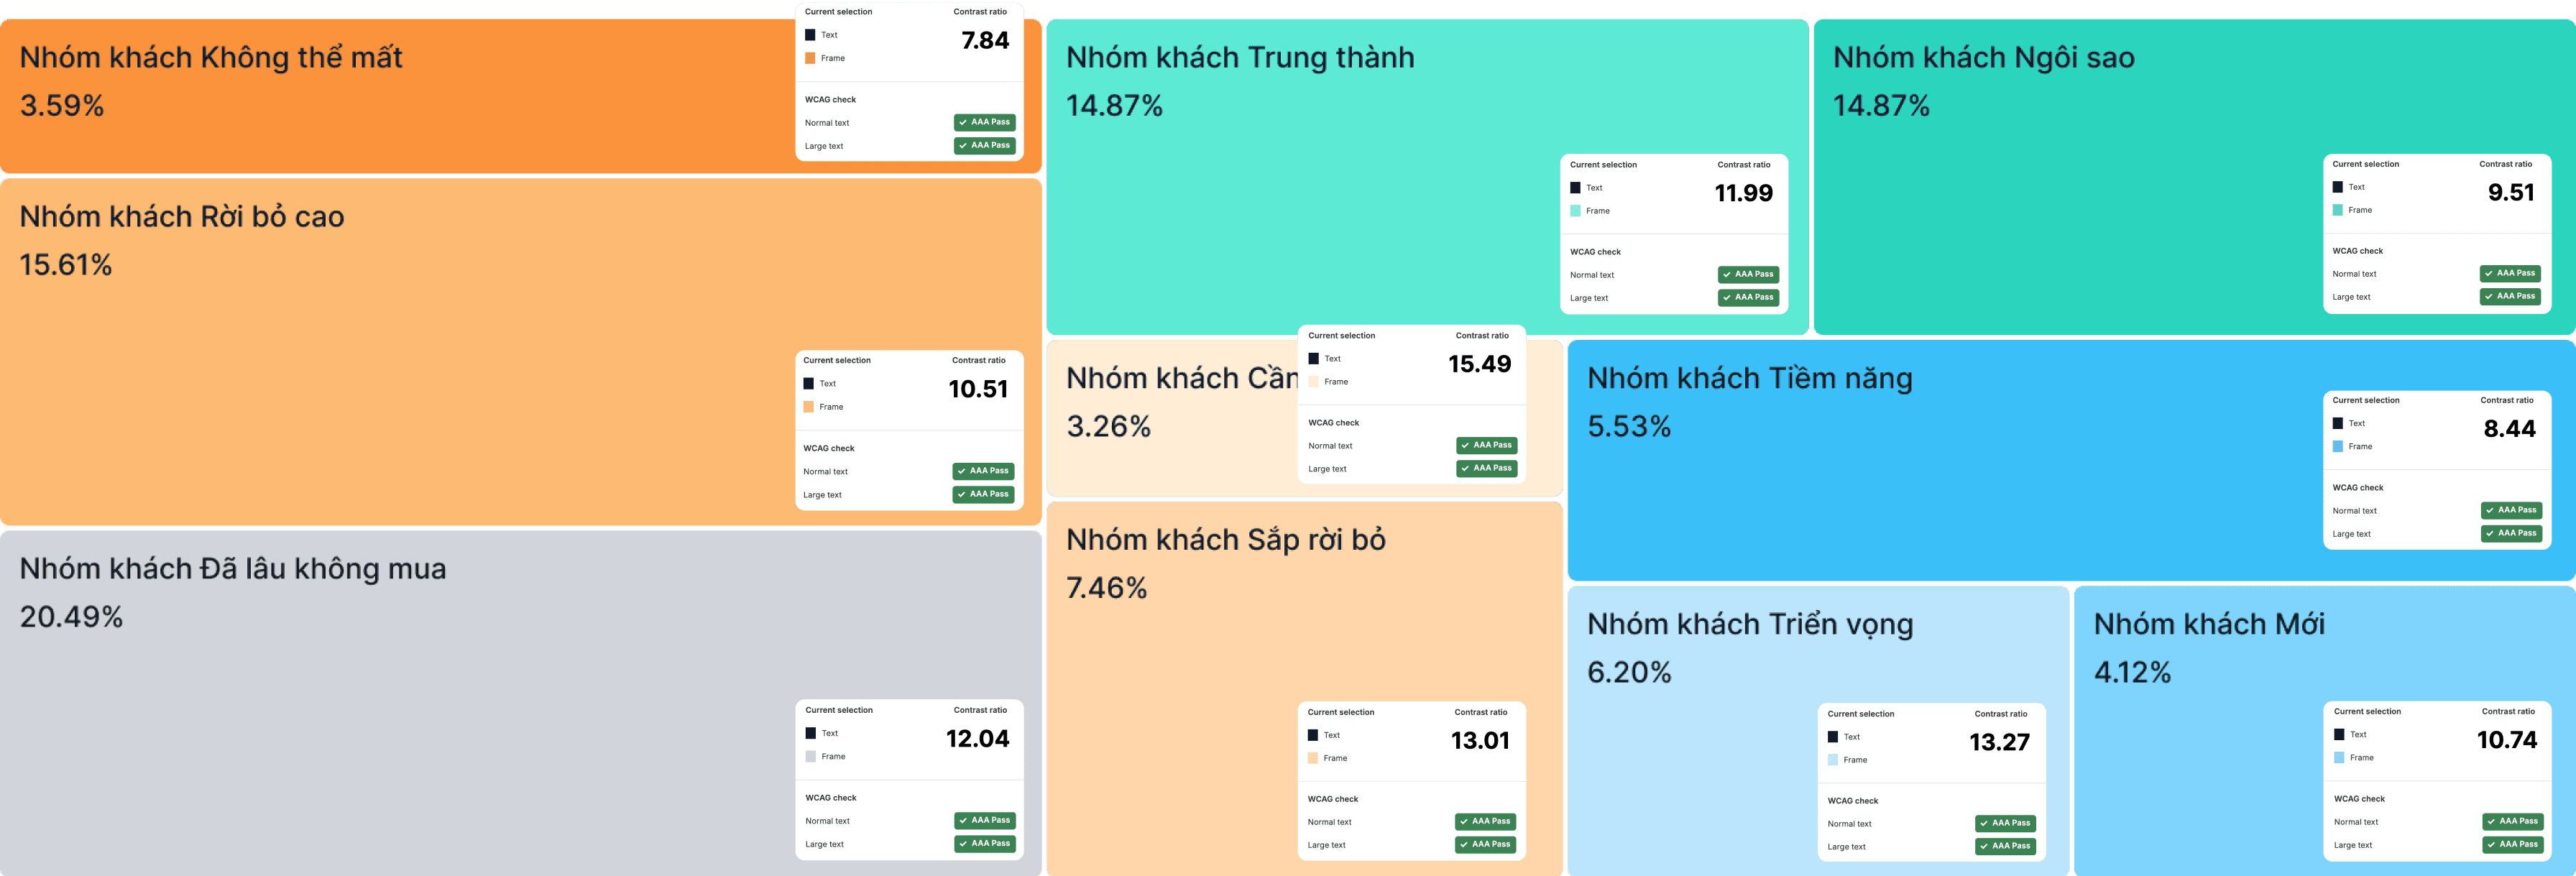
As I mentioned, there are sum of 10 segments in the RFM model. But there had no the color guideline to visualize each segment in the chart yet. My challenge is to define the color scheme to make merchants easily identify them as well as meet the accessibility standard
🧠
Ideate
Through the research, I found that the segments were arranged in order, based on the criteria of 'value and interaction level to the business’
Combined that, I've determined four single hues based on the safety level of segments for the business, from safe to unsafe.

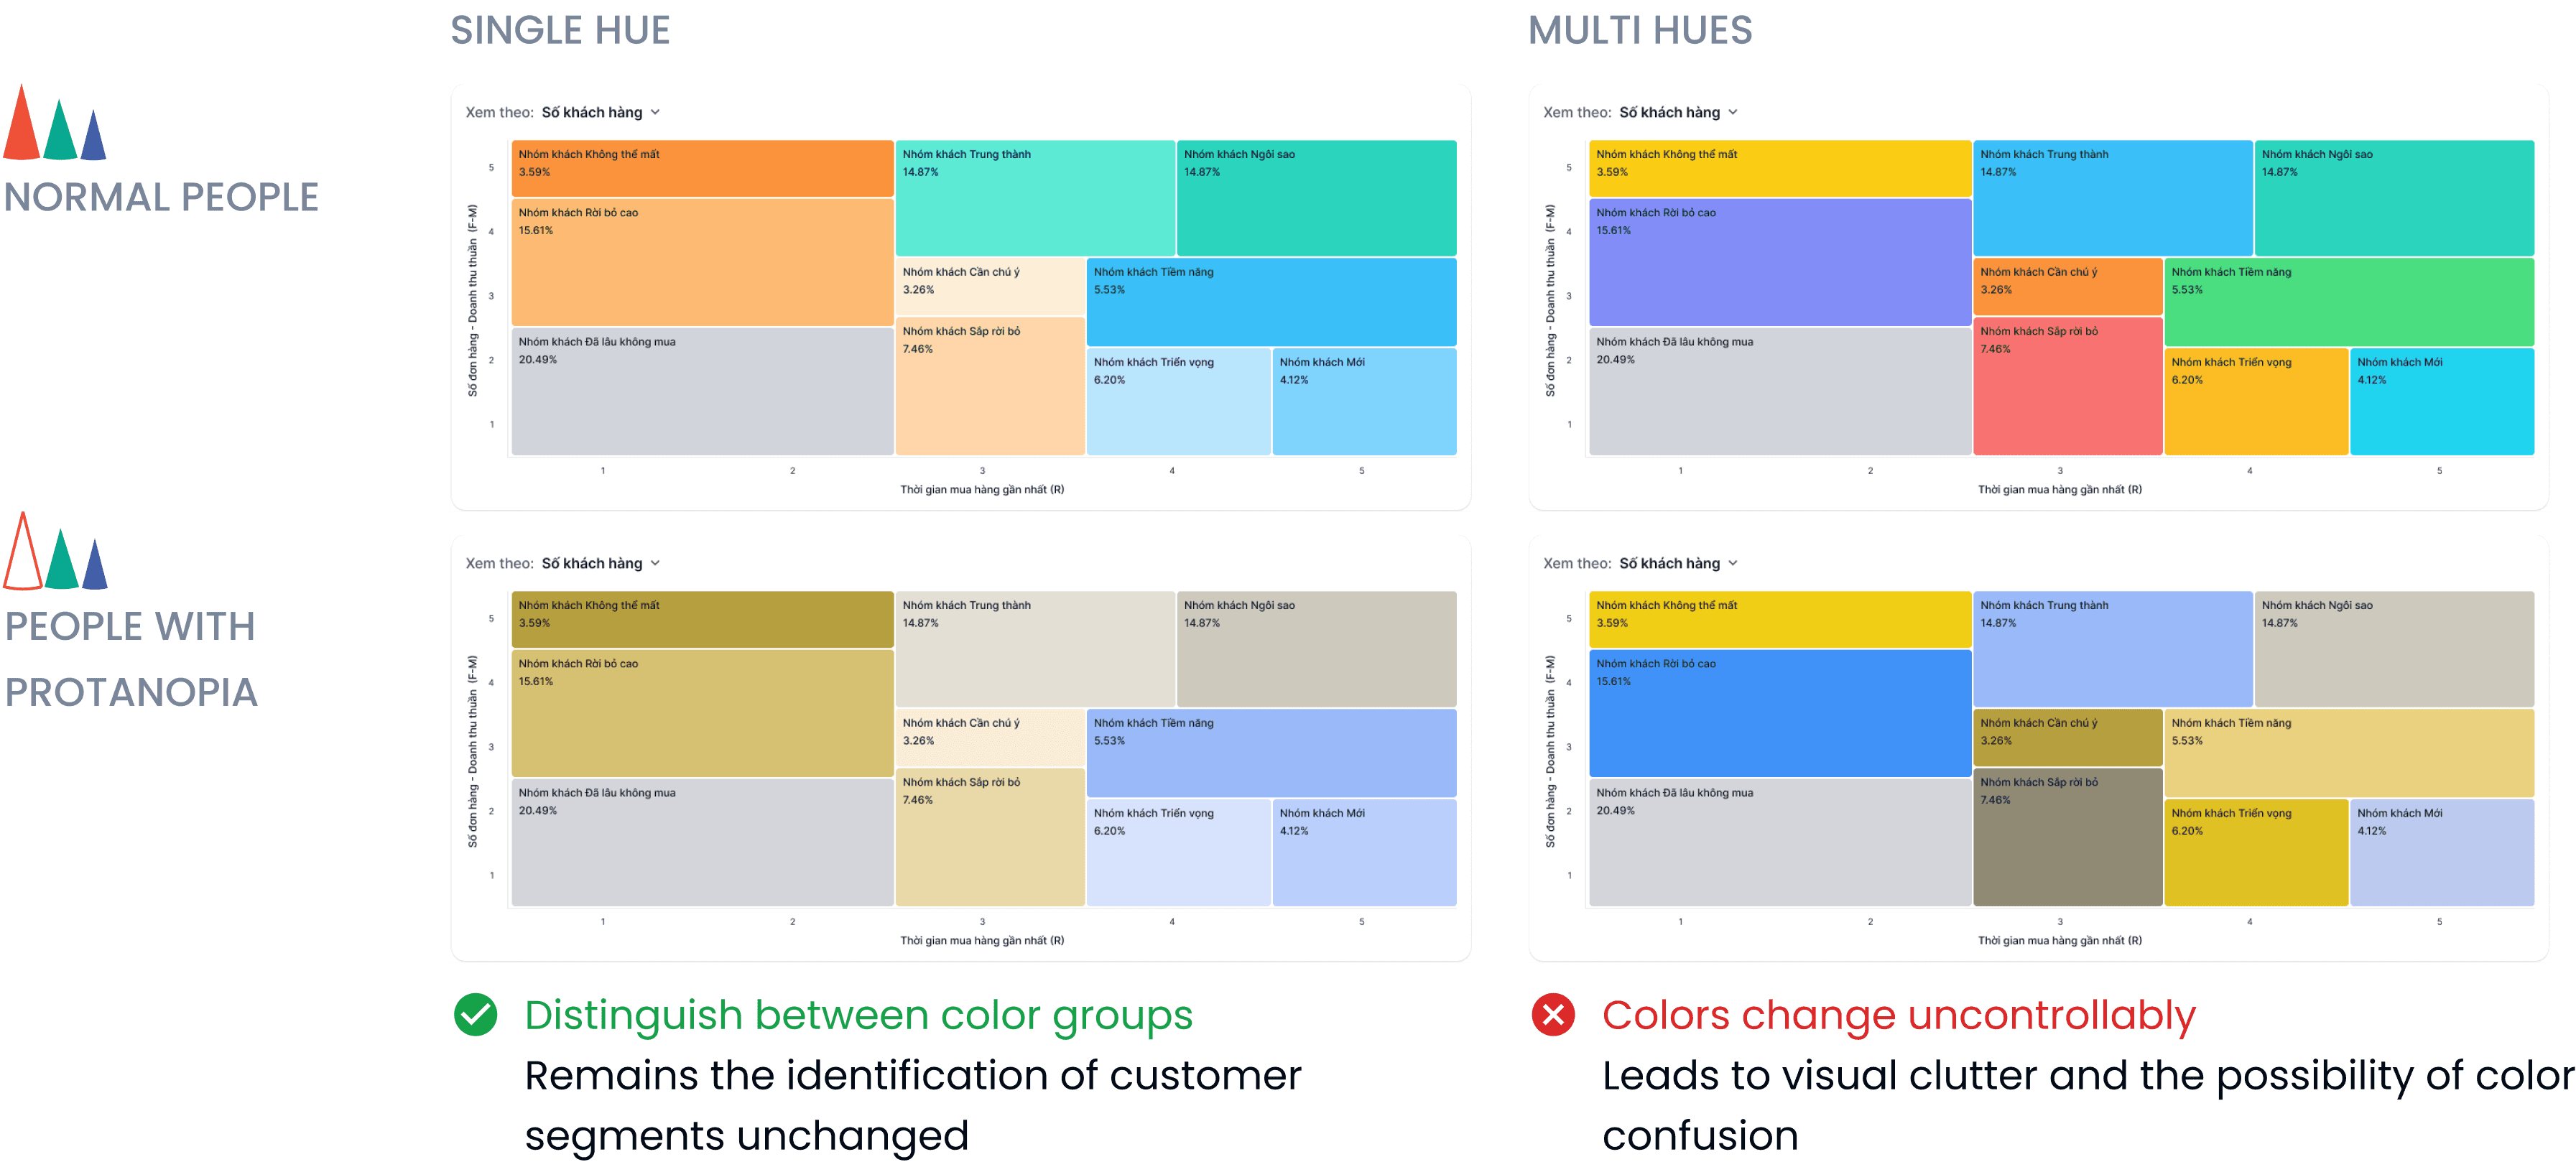
Moreover, it accommodates visual disability
The color scheme could meet the accessibility standards: WCAG AA and WCAG AAA, ensuring readability
Then, using a single hue palette will make the chart readable for all kinds of color blindness.
P/s: Thanks to Color Blind, a Figma plugin that helps me understand how color-blind people see.
Prototyping
Summary of my deliverables about the solution
Responsive
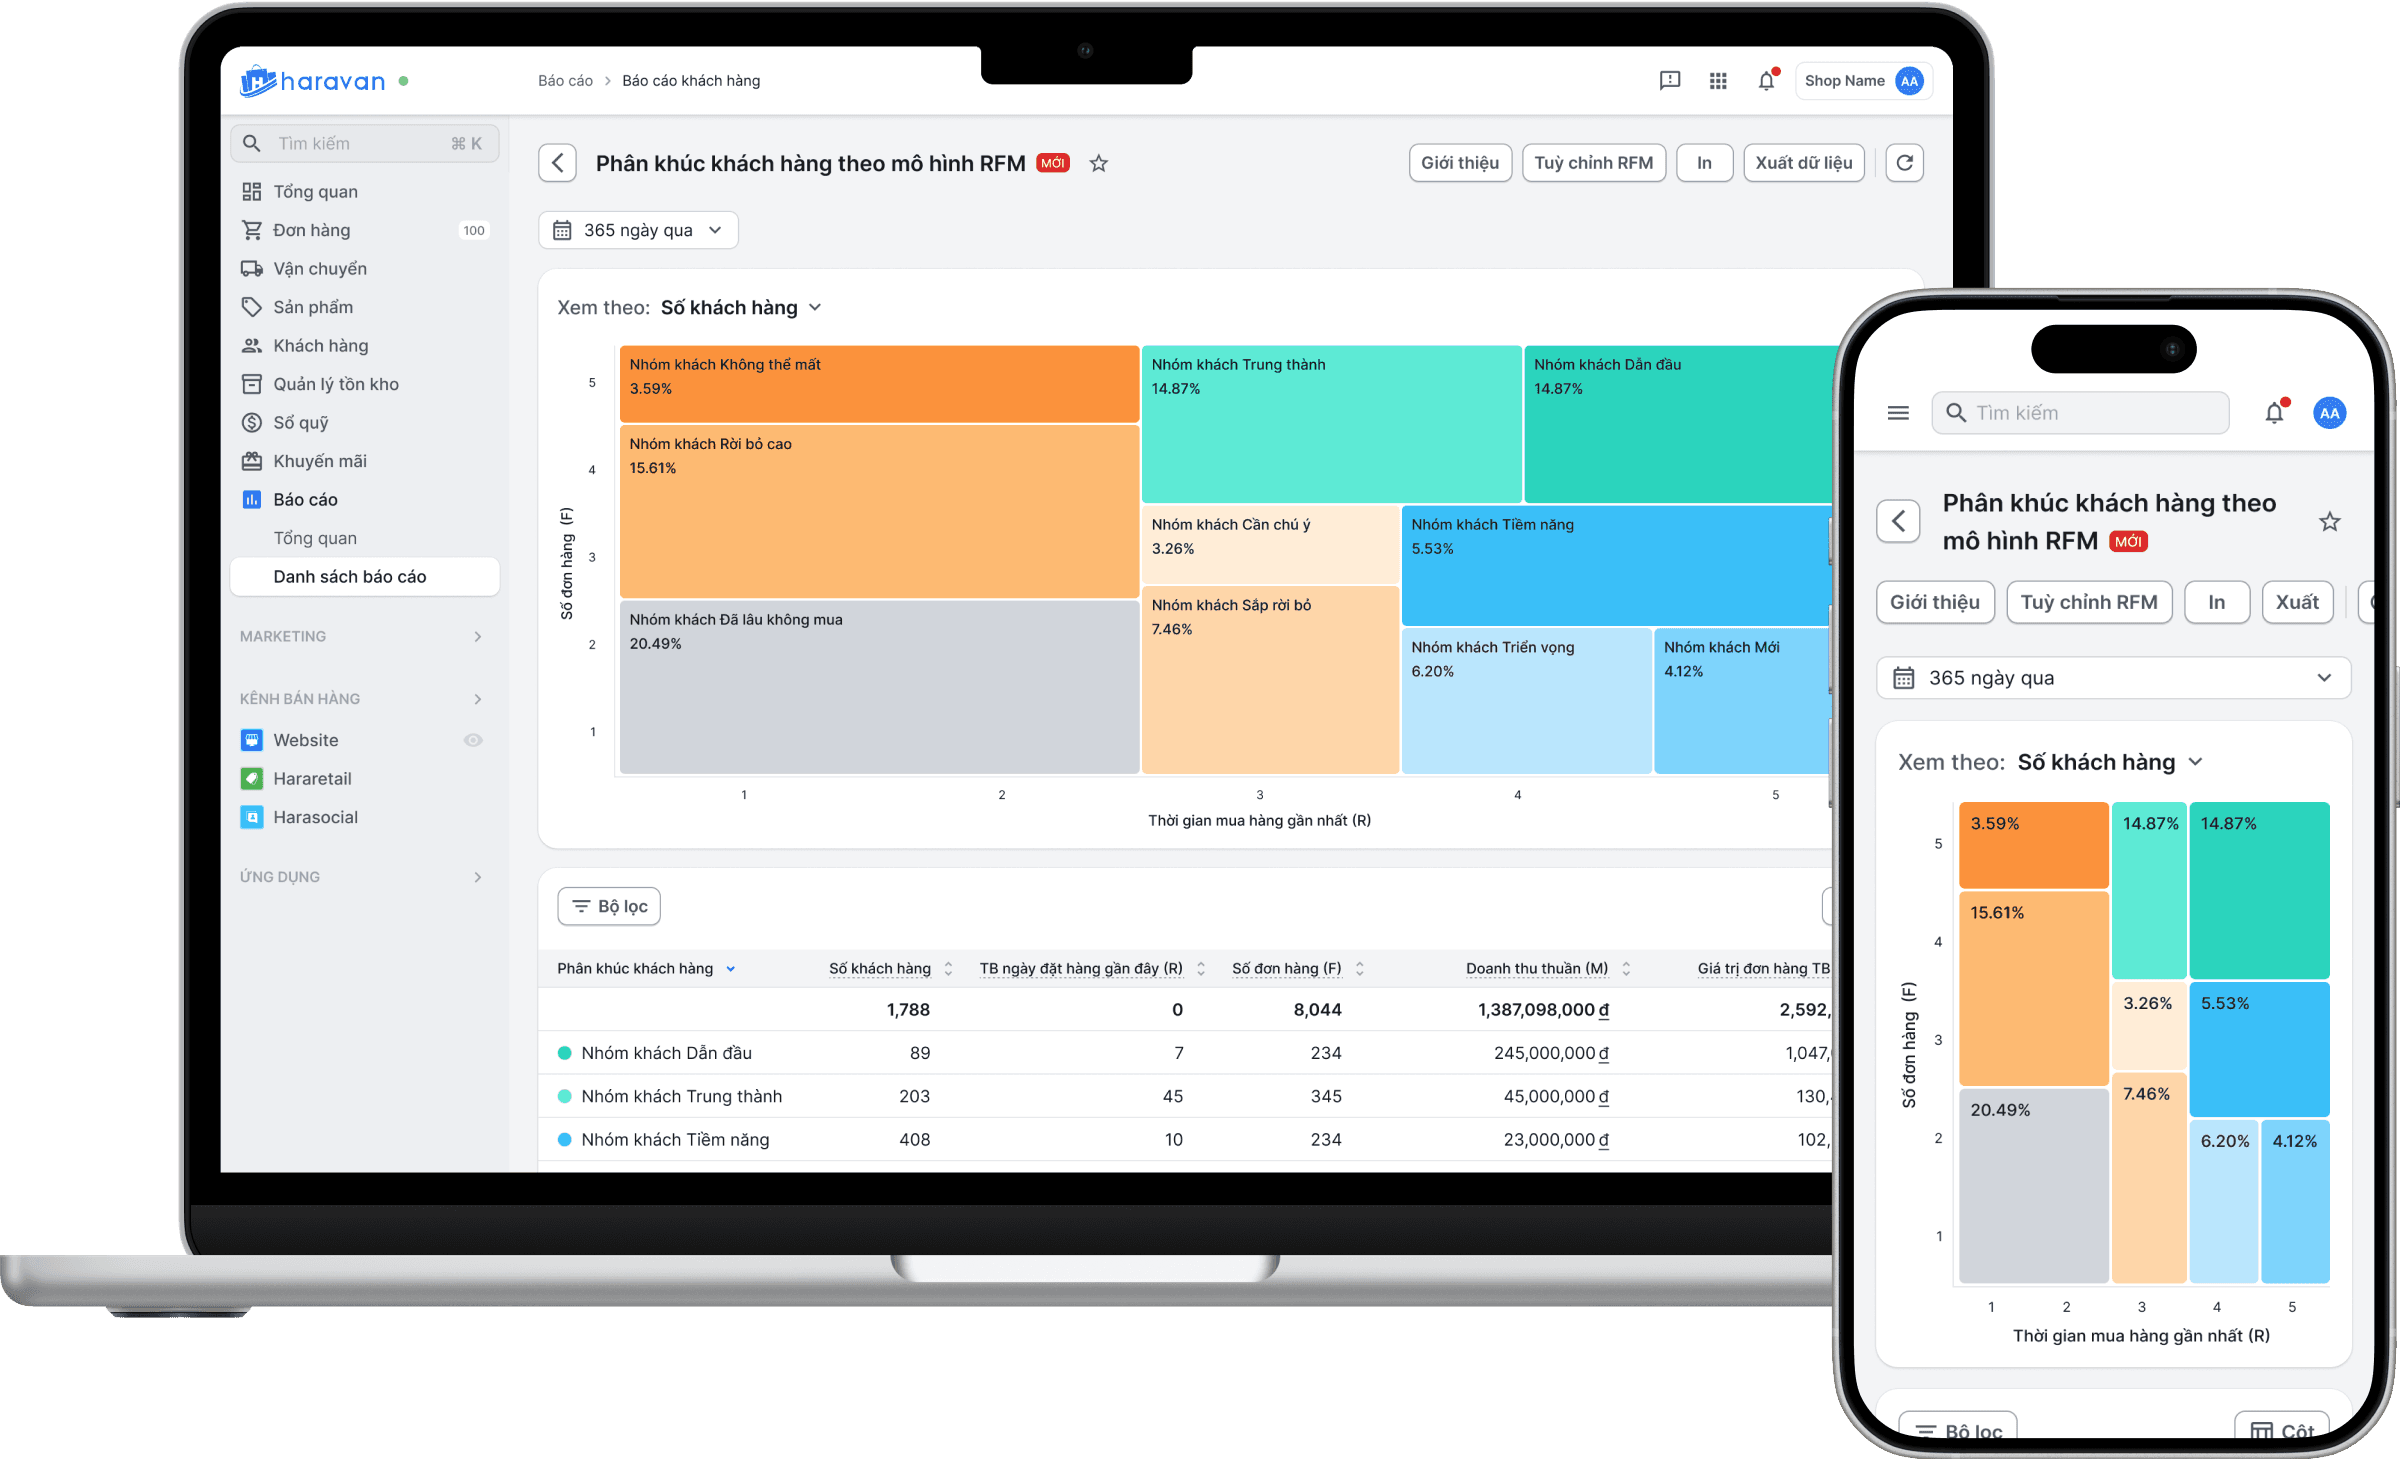
Our product is a web-based platform, almost all merchants use desktop as their primary device (95.2%). So our approach is desktop-first.
For mobile devices, we still adhere to the standards. We would like to ensure users can still access on mobile.
📚 Lessons learned
• Have more empathy when playing the merchants' role
During the research phase for the new feature, I realized the importance of empathy, especially for merchants who are new to this field—much like I was at the time. This experience taught me to simplify the learning curve by making terminology and concepts easier to understand.
• Try best to make data visualization accessible
For me, data visualization is an opportunity for designers to enhance the accessibility for their product. Avoiding using multiple hue as well as ensuring the color contrast by adhering to WCAG guideline can better the readability of the chart.
• Advocate for design in cross-functional teams
I persuaded my squad team including PO, front-end & back-end developers when presenting my solution. The members said they were first introduced to the concept of accessibility (at least partially). I'm proud to see it as one of my achievement.
Thanks for your view !
